
Skip to content

Our 2025 Annual Report is now live — Read the full report

Education Policy Institute home

How have A level subjects evolved over the last two decades?

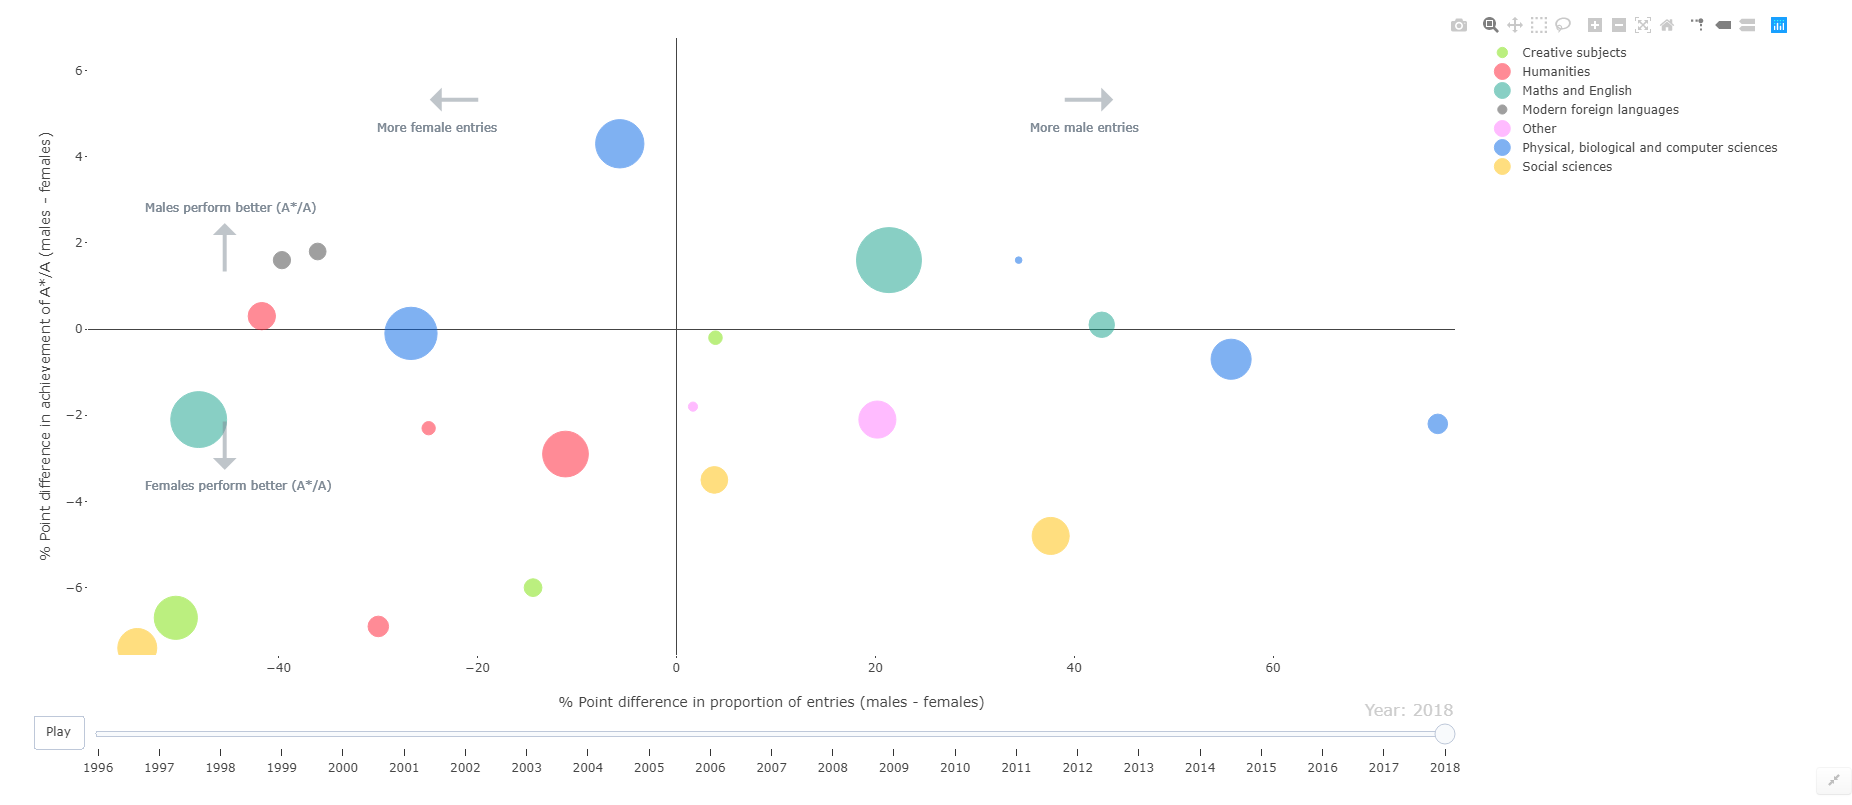
This interactive chart illustrates the gender gap between males and females in A level subject entries and attainment for each year between 1996 and 2018.

It is based on published Department for Education statistics covering students at the end of Key Stage 5 in England. 

Click on the image below to begin using the chart. 
interactiveAlevels

Our full analysis of 2019’s A level results can be found here.

Stay connected

Subscribe to our newsletter

Stay up to date with our most recent publications, reports, briefings and events on education and young people’s wellbeing.

Subscribe today

Further reading