The Department for Education routinely uses the statistic:
“90% of schools are now rated Good or Outstanding, up from 68% in 2010”
This claim is, perhaps unsurprisingly, true.
We expect such government lines to be factually accurate, after all there is an army of civil servants rigorously checking and re-checking these statistics before they are stated in public. So it is true; 68% of schools were Good or Outstanding at the end of the 2009/10 academic year, and at the end of the 2022/23 academic year this figure was 89%. However, as with all such simple headlines there is a lot more nuance hiding behind it.
In the following short piece I uncover some of this nuance and show why we should be careful in how we go about interpreting DfE’s headline claim. Particularly with regard to the implication of such a statement, that school standards have therefore improved over this period. This short blog focuses on exploring the veracity of the claim, not the more fundamental question of whether one-word Ofsted judgements are a fair and accurate way of assessing school performance.
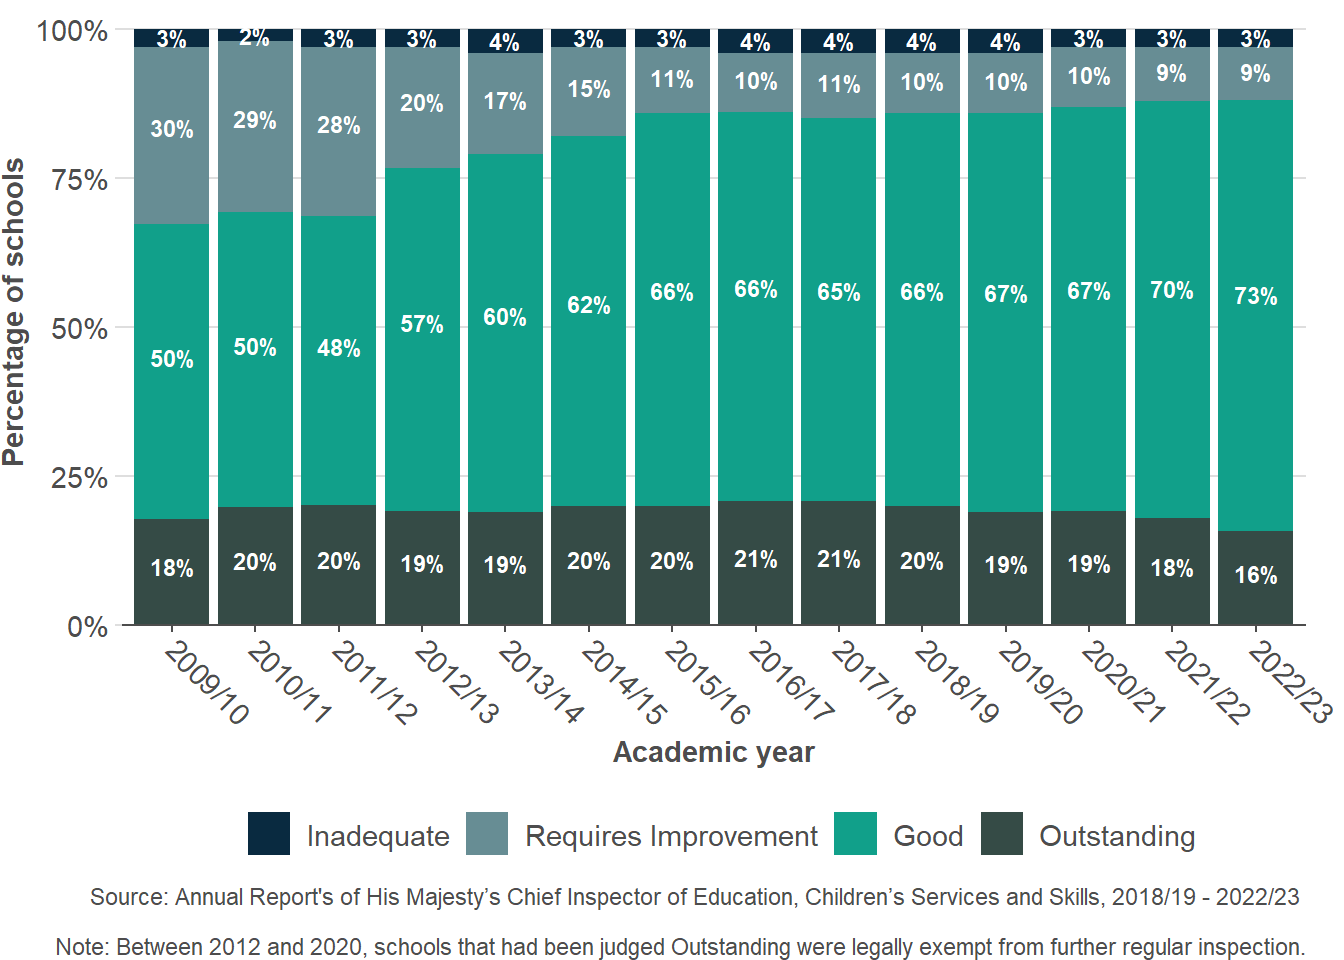
Figure 1 shows the percentage of schools with each Ofsted grade at the end of each school year since 2009/10.
Figure 1: Ofsted grades, 2009/10 to 2022/23
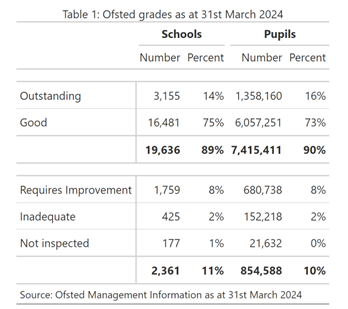
The first omission of the headline figure is that whilst the percentage of Good or Outstanding schools combined has steadily increased over the period, the percentage of Outstanding schools has actually fallen from 18% to 16% since 2010. Table 1 shows the most recent data as of March 31st 2024. This shows the fraction of Outstanding schools continues to fall. Today there are a third less Outstanding schools (14%) compared to a peak in 2016/17 and 2017/18 (21%). However, it should be noted that between 2012 and 2020, schools that had been judged Outstanding were legally exempt from further regular inspection, unless there were specific concerns about the school.
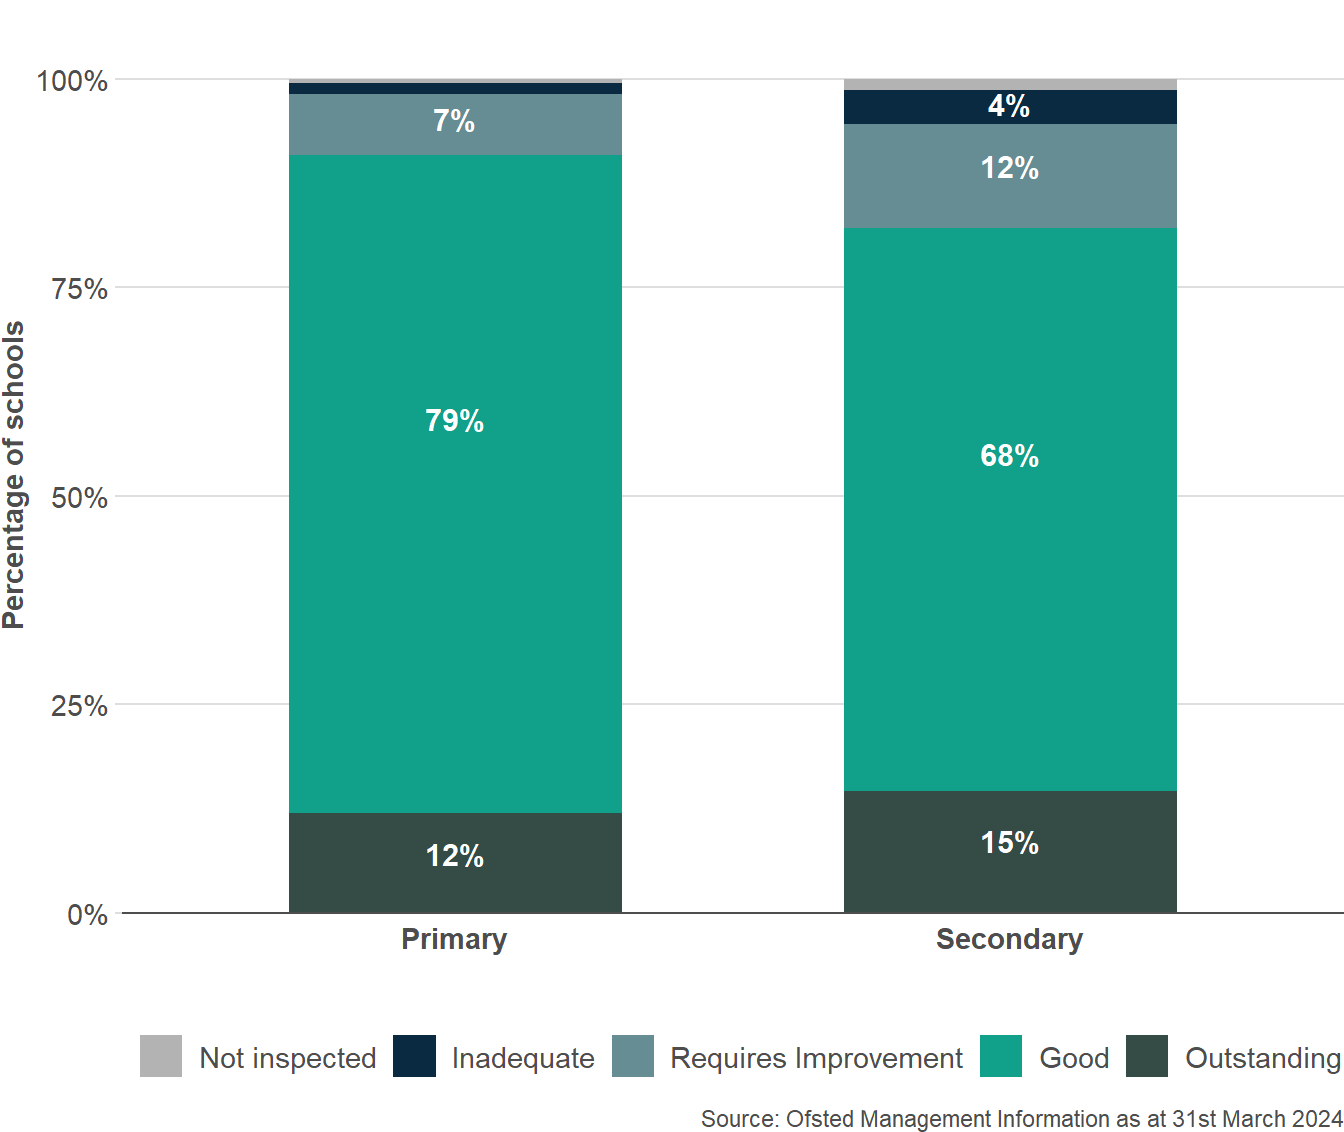
Figure 2 shows there is also variation across phase. The headline therefore hides that whilst 91% of Primary schools are currently rated Good or Outstanding, this is true of only 83% of Secondary schools. However, a greater percentage of Secondary schools are currently rated Outstanding (15%) compared to Primary schools (12%).
The headline also does not touch on how long has it been since schools were last inspected?
This is important because if schools have not been inspected for a long time, we can not be sure that the ratings are an accurate reflection of performance today.
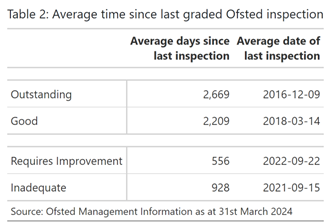
Whilst the exemption on inspecting Outstanding schools was lifted in 2020, many Outstanding, and even Good schools, have not been inspected for a long time. Table 2 shows that on average, schools currently rated Outstanding were last inspected 7.3 years ago. Schools currently rated Good have typically been inspected more recently, but still on average they were last inspected 6.1 years ago.
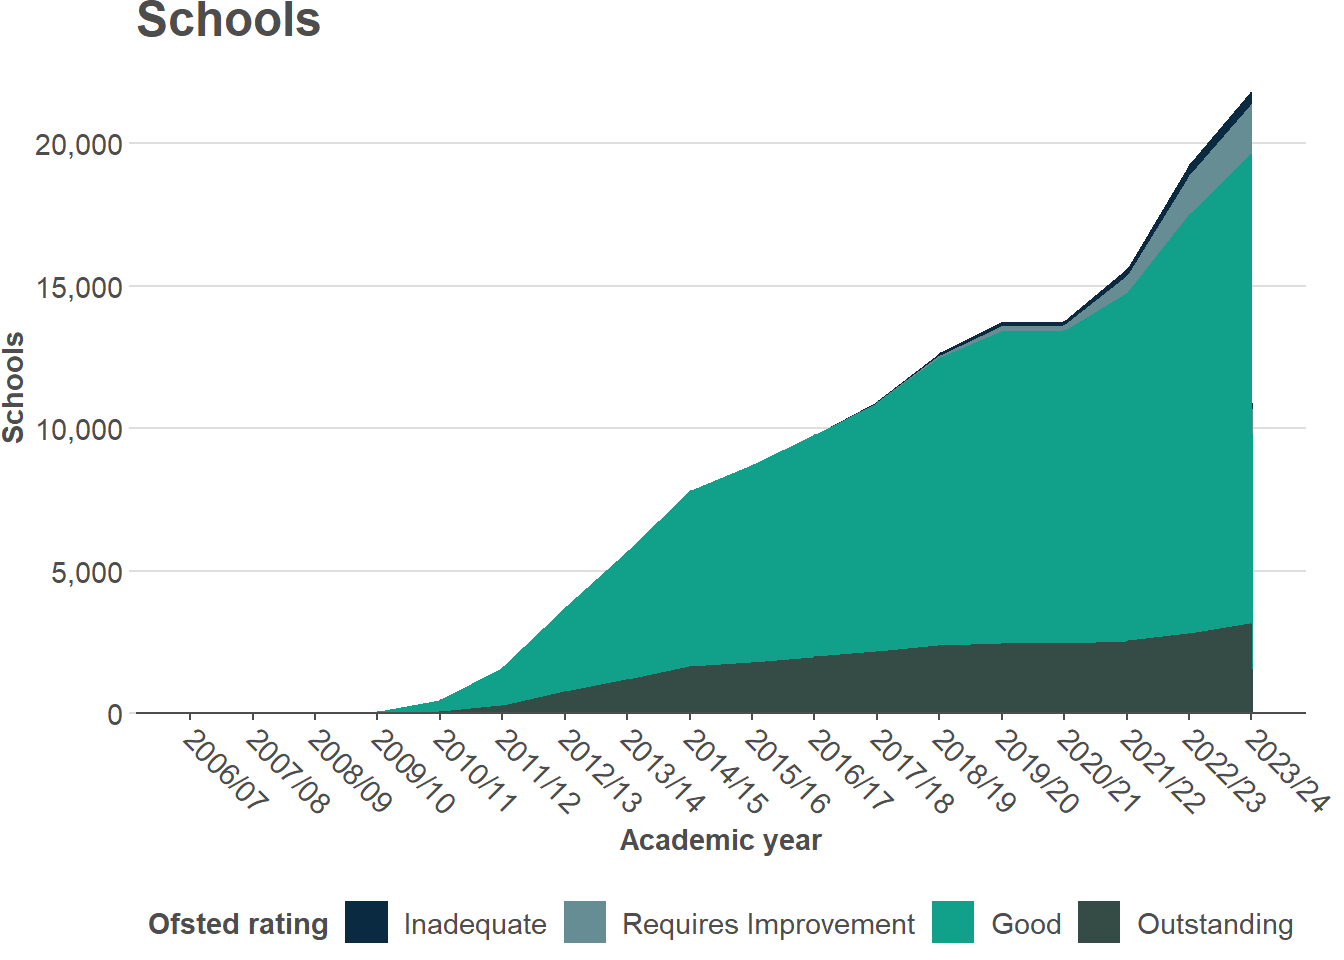
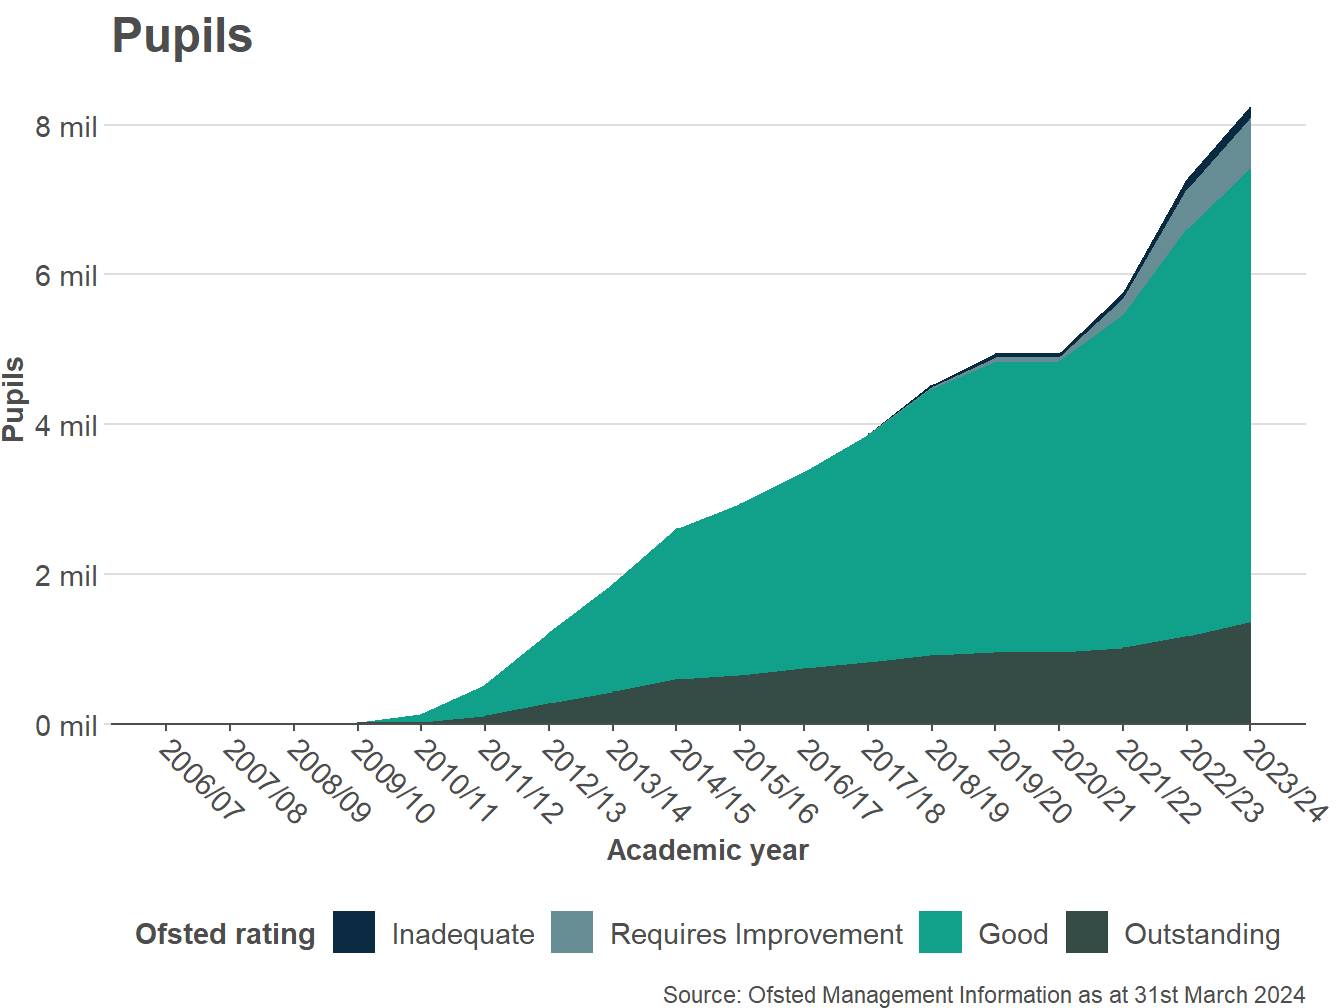
Admittedly, only very few (68) Good or Outstanding schools have not been inspected since 2010, the year the headline figure refers to. However, 38% of currently Outstanding schools and 27% of currently Good schools have not been inspected in the last 10 years.
That means that around 1.9 million, or almost 1 in 4, pupils currently attend a Good or Outstanding school that has not been inspected in the last 10 years.
Figure 3: Number of schools not inspected before date
This still begs the question; is it really a problem that these schools have not been inspected for such a long time?
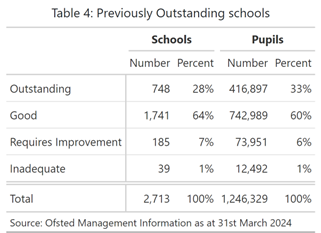
Over the last 10 years, 2,713 Outstanding schools have been inspected. Table 4 shows the outcomes of the inspections of these schools. Of these previously Outstanding schools, only 28% retained their Outstanding rating. Taken together with the relatively high fraction of schools that have not been inspected in the last 10 years, this suggests the headline figure could be a misleading representation of the true performance of schools today (though it should be remembered, that prior to the recommencement of routine inspections in September 2021, Outstanding schools were only inspected if there had been specific concerns about their performance and hence falls for these schools were not necessarily unexpected).
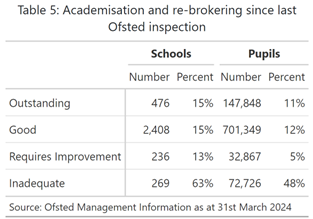
Another potential challenge to the headline figures is that 3,389 schools have undergone academisation or been re-brokered since their last Ofsted inspection. These changes often go hand in hand with significant changes in school governance structures, and so the Ofsted grades of these schools may not be a good reflection of their performance today. Table 5 shows that around 15% of currently Good or Outstanding schools have academised or been re-brokered since their last Ofsted inspection.
So, all in all, whilst the DfE’s headline is factually correct, it hides a lot if we want to understand whether this means school standards have improved. I have shown that:
The fraction of Outstanding schools appears to be falling and is less than in 2010.
Only 83% of Secondary schools are Good or Outstanding.
Ofsted grades may not be a good reflection of current performance;
The average Outstanding school hasn’t been inspected for over 7 years and the average Good school for 6 years. Important as we know re-inspection of Outstanding schools often leads to a change in grade.
15% of currently Good or Outstanding schools are operating under different governance arrangements to when they were last inspected.
Stay connected
Subscribe to our newsletter
Stay up to date with our most recent publications, reports, briefings and events on education and young people’s wellbeing.
I’ve spent the best part of two decades working in and around education policy. During that time we’ve had eight prime ministers, thirteen education secretaries and four Ofsted chief inspectors. Goodness knows how many conversations I’ve been involved in over…
In September 2024, the Government commissioned an independent Curriculum & Assessment Review to examine the National Curriculum to ensure it remains fit for purpose and delivers educational excellence for all. This marks over a decade since the curriculum offer was…
Disadvantaged students are, on average, one-fifth of a grade behind in English and one-eighth of a grade behind in maths when resitting GCSEs, according to research from the Education Policy Institute (EPI). Introduced in 2014, the resit requirement aims to…
A new paper published by the Education Policy Institute sheds light on the flaws of the current accountability system and calls for a fairer and more holistic approach to measuring school effectiveness. The paper highlights that: • Current performance measures…
This new report by the Education Policy Institute (EPI), funded by the Nuffield Foundation, finds that the four UK nations have begun to adopt increasingly different approaches to education policy after twenty years of devolution. The research, which is…
The Education Policy Institute has published its response to the Department for Education and Ofqual consultation on awarding GCSE and A level grades in summer 2021. The consultation follows the announcement earlier this month from the government that exams will…
The school system in England is underpinned by a system of accountability in which schools are compared through performance tables and Ofsted inspections. By international standards, England’s system is defined as one of high autonomy, with high accountability (OECD, 2015).…
By Jon Andrews, Emily Hunt, and Education Policy Institute
This week, students throughout the country received their A level grades and began the process of figuring out the implications for further study or entering the labour market. This analysis explores the policy background, before examining what we can see…
Following a consultation that received an unprecedented 15,000 responses, Ofsted’s new inspection framework for education has been released today. As must often be the case with schools, it is incredibly difficult to reconcile the positives and the negatives into a…