The Department for Education (DfE) recently announced in the schools’ white paper that they will provide increased guidance on how internal exclusion, also referred to as internal suspension, should be used by schools. This comes alongside the DfE’s positioning that external suspensions from school are ‘serious sanctions’ as ‘for some children being sent home could mean that they are left unsupervised and disengaged.’ Internal exclusion has therefore been primarily situated as an alternative sanction to suspension aiming to reduce lost learning time.
Internal exclusion is a disciplinary sanction resulting in pupils being temporarily removed from the mainstream classroom but remaining on the school site. Pupils are able to continue their education in a supervised setting although their education may differ from that of the mainstream curriculum.
Given the DfE’s renewed support for the use of internal exclusion, it is vital to understand how internal exclusion and other exclusionary practices (i.e. practices that result in pupils being removed from the classroom) are currently being used by schools and how they relate to wider behaviour management strategies. In this blog, we leverage novel data on classroom removal practices, including internal exclusion, and school behaviour policies to conduct exploratory analysis examining schools’ use of exclusionary behaviour management. Building from our previous work, ‘Do behaviour policies matter?‘, we also specifically examine the relationship between school behaviour policies and internal exclusion.
The data
As data on classroom removal practices is not currently collected at a national scale, we submitted a Freedom of Information (FOI) request to all secondary schools in three London boroughs: Hackney, Tower Hamlets and Lewisham. We were particularly interested in examining behaviour management practice amongst schools in Hackney following continued and recent news coverage of harmful discipline practices. Tower Hamlets and Lewisham were then also selected for analysis as they share broadly similar demographic and economic profiles with Hackney, facilitating comparison.
Despite such geographic similarities, there is substantial variation in behaviour management practice within and across these boroughs. For example, as of the 2024/25 Autumn term, Hackney reports on average significantly higher rates of exclusion and suspension among secondary schools than Lewisham and Tower Hamlets.[1]
To probe this variation further, we requested data from schools regarding their use of managed moves, internal alternative provision, internal exclusion, and part-time timetables as defined in the table below for the 2024/25 academic year.
This data collected via FOI request was then linked with publicly available data on schools’ suspensions and permanent exclusions rates as well as with our previous analysis’ code frame characterising schools’ behaviour policies.
Figure 1: Classroom removal practices definitions
Classroom removal practice
DfE definition
Data request for the 2024/25 academic year
Internal Exclusion
A disciplinary sanction which results in a pupil being removed from the classroom but remaining on the school site for a limited period of time. The pupil’s education will continue in a supervised setting although it may differ from the mainstream curriculum.
The number of pupils who experienced one or more internal exclusion sessions, or were removed from class for at least one session for a behaviour-related reason.
Managed Move
A voluntary, permanent move between mainstream schools made when in the pupil’s best interest.
The total number of managed moves initiated.
Internal Alterative Provision
An in-school unit, which can accommodate pupils from other schools, that provides additional support for one or more of the following: behaviour, attendance, academic performance, Social Emotional and Mental Health (SEMH) and Emotionally Based School Avoidance (EBSA).
The number of pupils who were placed in internal alternative provision.
Part-time timetable
Pupils only attend mainstream education on a part-time basis.
The number of pupils who were placed on a part-time timetable for a behaviour-related reason at any point.
School leavers
—
The number of pupils who left the school roll while in Year 10.
Who answered our Freedom of Information (FOI) request?
Over two-thirds of schools (33 out of 47 secondary schools) responded to our Freedom of Information request. Some types of schools were more likely to answer than others.
Specifically, schools in Hackney were less likely to respond to our FOI request. Across boroughs, academies, and in particular academy converter schools, were more likely to respond. We also found that the schools who did answer our FOI request tended to have lower rates of suspension and exclusion than schools that did not respond.
Figure 2: FOI response rates by school characteristic
Local Authority
School Type
Formal Exclusion
Hackney
Lewisham
Tower Hamlets
Academy Converter
Academy Sponsor Led
LA Maintained
Free Schools
Suspension Rate*
Exclusion Rate
Answered
60% (9)
(71.4%) (10)
77.8% (14)
91.7% (11)
63.6% (7)
64.7% (11)
57.1% (4)
3.54
0.062%
Did not Answer
40% (6)
28.6% (4)
22.2% (4)
8.3% (1)
36.4% (4)
35.3% (6)
42.9% (3)
5.29
0.086%
*Suspension rate refers to the number of suspensions per 100 pupils; (x) refers to count of schools
Amongst schools that answered our FOI request, 21.2 per cent failed to provide information on internal exclusion. Schools that did not report information on internal exclusion typically cited that this data was not readily accessible but indicated that internal exclusion was being used. Such variation in how schools use and access data raises important considerations surrounding the growing and continued use of internal exclusion without the necessary data, evaluation and accountability frameworks accompanying the practice. In this area, practice has evolved faster than policy.
The data biases and patterns amongst which schools answered our FOI requests also underlines the importance of requiring schools to collect and monitor data on internal exclusion. It is vital that all schools are, at the very least, able to track which of their pupils are spending significant periods of time outside of the mainstream classroom. Monitoring which pupils are being removed from the classroom is vital for schools to ensure that vulnerable groups of pupils are not disproportionately removed in line with the 2010 Equality Act and, that where relevant, pupils are being flagged for Special Educational Needs and Disabilities (SEND) assessment and intervention.
How prevalent are classroom removal practices?
Figure 3: Descriptive statistics of classroom removal practices
Type of classroom removal practice
Percent of schools using practice in 24/25
Mean Rate
Minimum Rate
Maximum Rate
Internal Exclusion
96%
20.4%
1.76%
51.32%
Managed Moves
75%
0.57%
0.08%
2.62%
Internal AP
45%
1.84%
0.08%
6.24%
Leaving Rate
88%
1.07%
0.16%
2.25%
Suspension
88%
2.89%
0.36%
8.22%
Permanent Exclusion
36%
0.17%
0.08%
0.38%
Type of classroom removal practice
Percent of schools using practice in 24/25
Mean Number
Minimum Number
Maximum Number
Part-time timetables
40%
2.4 pupils
1 pupil
6 pupils
** Mean and minimum rate statistics only include schools using the practice
Nearly all secondary schools are using internal exclusion. Amongst those using the practice, one in five pupils are on average being internally excluded in an academic year. This aligns with The Key Group’s analysis of Arbor Management Information System data from 762 schools, which similarly found that on average just over 18 per cent of pupils experience internal exclusion.
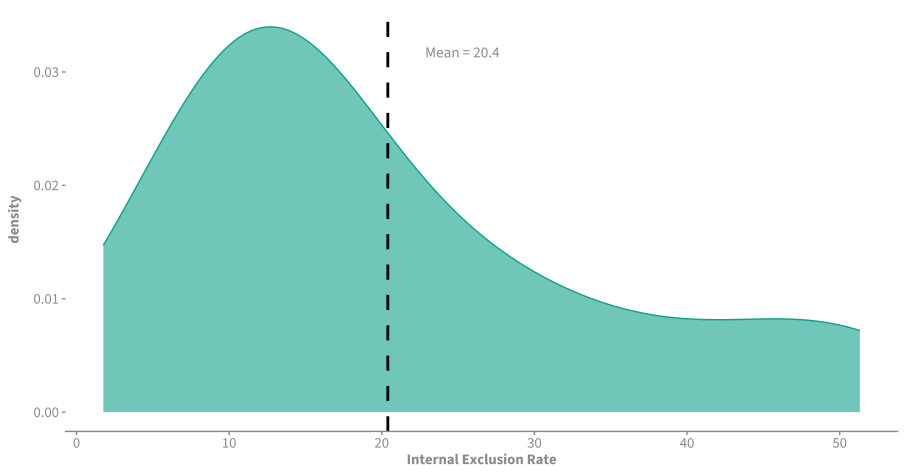
Figure 4: Density curve of internal exclusion rates
There is considerable variation in school internal exclusion rates. Our analysis finds that schools’ use of internal exclusion can range from under two per cent to over 50 per cent of pupils. As seen in Figure 4, the distribution is right skewed with most schools’ internal exclusion rates falling between 10 and 15 per cent. This raises questions as to whether such variation in internal exclusion rates results from differences in pupil behaviour across schools or more fundamental differences in how schools are defining and using internal exclusion as part of their wider behaviour management strategy.
Internal alternative provision (IAP) is used by a considerably smaller, but still significant proportion of schools – 48 per cent. In our sample, two schools reported extremely high rates of IAP (>30 per cent). Further follow-up revealed that these schools did not discretely distinguish internal exclusion from IAP. Excluding these two cases, internal alternative provision is on average experienced by 1.84 per cent of pupils and used in 45 per cent of schools.
Blurred distinctions between internal exclusion and IAP within schools’ data likely reflects blurred understandings of the purpose of classroom removal. It is unclear when removal is meant to function as a sanction and when it is being used to provide additional support. Distinguishing between internal exclusion and IAP is necessary for both teachers and pupils to ensure that removed pupils are receiving the appropriate pastoral and educational support outside the mainstream classroom.
Substantially smaller proportions of pupils experience a managed move or part-time timetable within our sample, yet these practices are still fairly widespread across schools. Managed moves are more likely to be used by schools than part-time timetables. This likely reflects the fact that part-time timetables will be used in very specific circumstances (such as serious ill health) whereas managed moves are more likely to function as an integrated part of the secondary school system (focused on engagement and discipline).
What relationships are there between classroom removal practices and school characteristics?
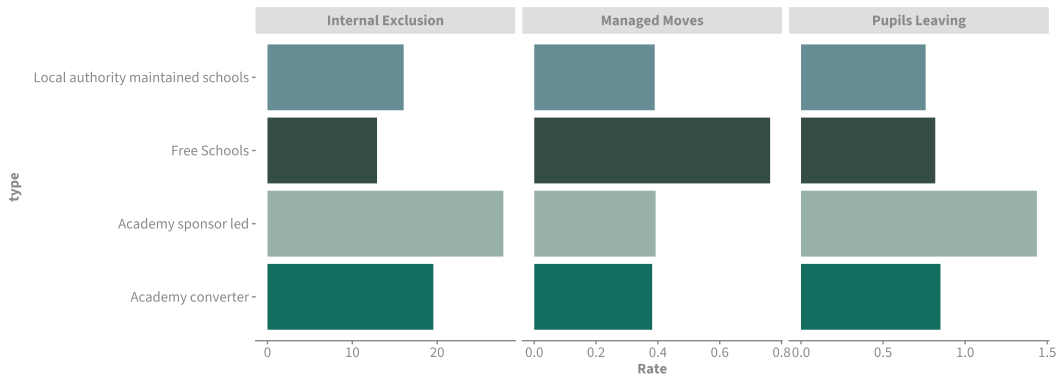
Digging deeper into the data, substantial variation by school type emerges. Particularly, we see that academy sponsor-led schools tend to report the highest average rates of internal exclusion and pupils leaving the school in year 10 while free schools report the highest rates of managed moves.
Excluding free schools, we see similar rates of managed moves across academies and LA maintained schools, a pattern that is not evidenced across internal exclusion and the rate of pupils leaving. Consistency in the use of managed moves across school types may be a result of increased guidance from the DfE regarding how and when managed moves can be used. Further research should investigate this pattern on a larger scale and more robustly consider the implications of DfE policy on classroom removal practices.
Figure 5: Classroom removal practices by school type
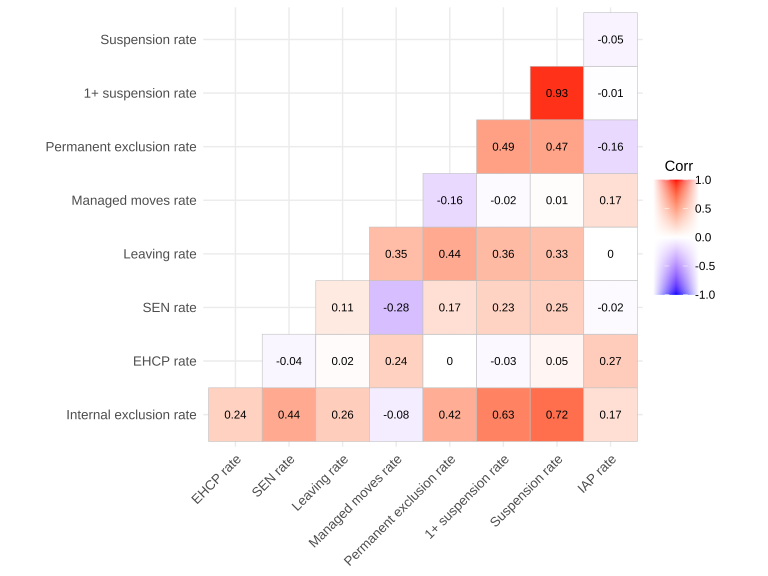
We also examined the relationships between classroom removal practices as well as school SEN and Education Health and Care (EHCP) rates. Notably, the strongest association is between internal exclusion and our two measures of suspension, with strong positive correlations (r = 0.63; r = 0.73), indicating that higher levels of internal exclusion are associated with both higher frequencies (suspension) and higher rates (1+ suspension) of suspension.
This correlation indicates that internal exclusion, as currently used in these London schools, does not appear to function as an alternative measure to suspension. Instead, our analysis highlights that schools with high rates of suspension report comparatively high rates of internal exclusion, indicating that schools are using internal exclusion alongside external suspension. Further research should more closely examine the relationship between internal exclusion and suspension in practice.
Figure 6: Correlation heatmap of classroom removal practices and school characteristics
Figure 5 also shows moderate positive correlations between the use of internal exclusion and school SEN rates (r = 0.44) as well as between the use of internal alternative provision and school EHCP rates (r = 0.31). This may indicate that schools with higher rates of pupils with additional needs are more likely to utilise spaces outside the mainstream classroom, such as IAP and internal exclusion, in response to these needs.
Due to our small sample size, the above correlations must be interpreted with caution. Robustness checks and sensitivity analysis reveal that only the relationship between internal exclusion and suspension is robust to testing within our sample, suggesting the relationship is unlikely to be driven by outliers or chance.[2] Nevertheless, the above tentative correlations between internal exclusion and SEN rates and IAP and EHCP rates should continue to be explored amongst larger samples.
Recognising the strength and robustness of the relationship between internal exclusion and suspension, raises questions surrounding how these practices may be linked. To better understand to what extent the use of internal exclusion is related to suspension through schools’ broader behaviour management approach, we draw upon our previous work examining school behaviour policies.
How does schools’ use of internal exclusion relate to school behaviour policies?
In our previous blog, ‘Do behaviour policies matter?’, we used a systematic text analysis approach to develop a coding framework capturing more than 30 features of school behaviour policies. Behaviour policies offer a consistent and publicly available source of data on how schools structure discipline and support their pupils. In the below section, we examine patterns between internal exclusion rates and behaviour policy features.
We find that certain behaviour policy features are more likely to be associated with higher internal exclusion rates than others:
Schools that incorporate students’ voice into their behaviour policy tend to on average have a lower internal exclusion rate of 13.7 per cent compared to 25 per cent for schools which do not mention student voice.
Escalation from missed detentions is on average associated with lower internal exclusion rates than schools with no mention of escalation (16.6 per cent v 25.2 per cent).
Schools which explicitly prohibit contact between pupils, or what we refer to as a ‘no touch’ policy, tend to on average have a higher internal exclusion rate of 22.5 per cent compared to schools that do not 17.1 per cent.
Schools with more embedded uses of restorative approaches were more likely to have relatively low internal exclusion rates compared to schools with no references to restorative approaches (13.7 per cent v 25.7 per cent).
Figure 7: Behaviour policy features and internal exclusion rates
Behaviour policy characteristics
Characteristic flag
Avg. Internal Exclusion Rate
Number of Schools
Student Voice
Yes
13.6%
10
No
25%
13
Missed detention escalation
Yes
16.8%
16
No
25.2%
5
Same day detention
Yes
21.7%
9
No
16.4%
7
No touch policy
Yes
22.5%
12
No
17.3%
11
Trust standardised model
Yes
24.4%
6
No
19.8%
15
Alternative provision referral
Yes
22.2%
15
No
19.2%
6
Managed moves mentioned
Yes
18.7%
11
No
21.2%
12
Data monitoring
Yes
20.7%
8
No
21.7%
13
Re-admission meeting
Yes
21.2%
7
No
21.6%
11
Restorative language
Embedded approach
13.7%
5
Generic reference
19.1%
5
Core principle
18.2%
5
None
25.7%
8
Given the small sample size of our data, the above differences in means are susceptible to outliers and the group mean can shift drastically if a few data points in our sample are added or removed. Therefore, we cannot confidently say that these differences in internal exclusion rates are not the result of outliers or random variation in the data. Furthermore, given our focus on London schools, it is difficult to assess whether these patterns are likely to be found across the entire population of secondary schools. Nevertheless, they do indicate interesting London-based trends and highlight the need for wider data collection regarding internal exclusion and school behaviour policy features.
Conclusion
Our exploratory analysis of schools’ use of classroom removal practices in secondary schools across Hackney, Tower Hamlets, and Lewisham raises several important implications for policymakers and school leaders.
Firstly, we find that the use of internal exclusion, also known as internal suspension, is already widespread. Yet, our data indicates that internal exclusion is being used in very different ways across schools. While we expect some variation and want schools to tailor practice to their specific needs and context, the sheer breadth of variation in our sample’s internal exclusion rates (two to 50 per cent) is raises questions surrounding the value of consistency and indicates that schools are likely using internal exclusion for very different purposes.
Secondly, through our FOI requests we also find strong, positive correlations between internal exclusion and our two measures of suspension that are robust to statistical testing. Higher rates of internal exclusion being associated with higher frequencies and rates of suspension suggests that internal exclusion is not currently being used as an alternative measure to suspension in our sample of London schools.
Finally, our analysis highlights significant gaps in schools’ data collection. Over a fifth of schools answering our FOI request were unable to provide data regarding their use of internal exclusion. To ensure that internal exclusion is being used equitably and fairly, schools must ensure they are appropriately collecting and monitoring their data.
As DfE continues to support the use of internal exclusion it is vital that we build a clear picture of how this approach is used across schools, and that relevant legal protections and transparency measures accompany its use to ensure pupils’ right to receive a quality education is safeguarded.
References
[1] Hackney – 0.13 permanent exclusion per 100 pupils and 5.8 suspensions per 100 pupils; Lewisham – 0.06 permanent exclusion and 3.74 suspensions; Tower Hamlets – 0.01 permanent exclusions and 2.42 suspensions.
[2] Robustness checks and sensitivity analysis included permutation tests run with and without Bonferroni correction given the underlying distribution of our sample as well as leave-one-out sensitivity tests.
Stay connected
Subscribe to our newsletter
Stay up to date with our most recent publications, reports, briefings and events on education and young people’s wellbeing.
In this blog, we describe variation in behaviour policies and outcomes in three inner London Boroughs: Hackney, Lewisham and Tower Hamlets. Our analysis finds that the written behaviour policies of state secondary schools in these areas vary in ways that…
In recent years, public debates on gender have increasingly focused on boys and men falling behind. Data from Western countries consistently show long-term gaps in educational attainment, university enrolment, and degree outcomes. Boys are behind girls on every official child…
By Whitney Crenna-Jennings, Emily Hunt, and Education Policy Institute
A new National Framework, an old local lottery Since the pandemic, rising pupil absence has been one of the biggest challenges facing schools in England, with mounting evidence linking absence to worse GCSE and longer-term outcomes , and the widening disadvantage attainment gap . The government has been championing…
Educational psychologists (EP) support the wellbeing and development of young people up to age 25. Working alongside parents, teachers, and other professionals, they identify and address learning or behavioural barriers - ensuring that children facing difficulties get the support they…