Introduction
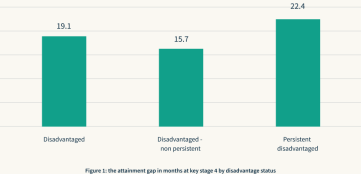
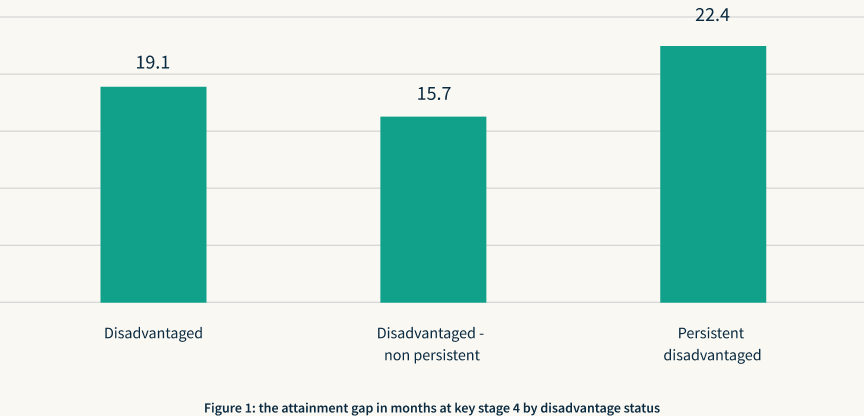
Persistently disadvantaged pupils fall behind their peers. Persistently disadvantaged pupils fall behind their peers. Persistently disadvantaged pupils fall behind their peers. Persistently disadvantaged pupils fall behind their peers. Persistently disadvantaged pupils fall behind their peers. Persistently disadvantaged pupils fall behind their peers. Persistently disadvantaged pupils fall behind their peers. Persistently disadvantaged pupils fall behind their peers. Persistently disadvantaged pupils fall behind their peers. Persistently disadvantaged pupils fall behind their peers. Persistently disadvantaged pupils fall behind their peers. Persistently disadvantaged pupils fall behind their peers.
Regional gaps
Persistently disadvantaged pupils fall behind their peers. Persistently disadvantaged pupils fall behind their peers. Persistently disadvantaged pupils fall behind their peers. Persistently disadvantaged pupils fall behind their peers. Persistently disadvantaged pupils fall behind their peers. Persistently disadvantaged pupils fall behind their peers. Persistently disadvantaged pupils fall behind their peers. Persistently disadvantaged pupils fall behind their peers. Persistently disadvantaged pupils fall behind their peers. Persistently disadvantaged pupils fall behind their peers. Persistently disadvantaged pupils fall behind their peers. Persistently disadvantaged pupils fall behind their peers.
Dashboard
Persistently disadvantaged pupils fall behind their peers. Persistently disadvantaged pupils fall behind their peers. Persistently disadvantaged pupils fall behind their peers. Persistently disadvantaged pupils fall behind their peers. Persistently disadvantaged pupils fall behind their peers. Persistently disadvantaged pupils fall behind their peers. Persistently disadvantaged pupils fall behind their peers. Persistently disadvantaged pupils fall behind their peers. Persistently disadvantaged pupils fall behind their peers. Persistently disadvantaged pupils fall behind their peers. Persistently disadvantaged pupils fall behind their peers. Persistently disadvantaged pupils fall behind their peers.
Closing thoughts
Persistently disadvantaged pupils fall behind their peers. Persistently disadvantaged pupils fall behind their peers. Persistently disadvantaged pupils fall behind their peers. Persistently disadvantaged pupils fall behind their peers. Persistently disadvantaged pupils fall behind their peers. Persistently disadvantaged pupils fall behind their peers. Persistently disadvantaged pupils fall behind their peers. Persistently disadvantaged pupils fall behind their peers. Persistently disadvantaged pupils fall behind their peers. Persistently disadvantaged pupils fall behind their peers. Persistently disadvantaged pupils fall behind their peers. Persistently disadvantaged pupils fall behind their peers.